


Liquefied sand (Rollins, 2005)
The p-y curve for liquefied sands is shown in Figure 1.
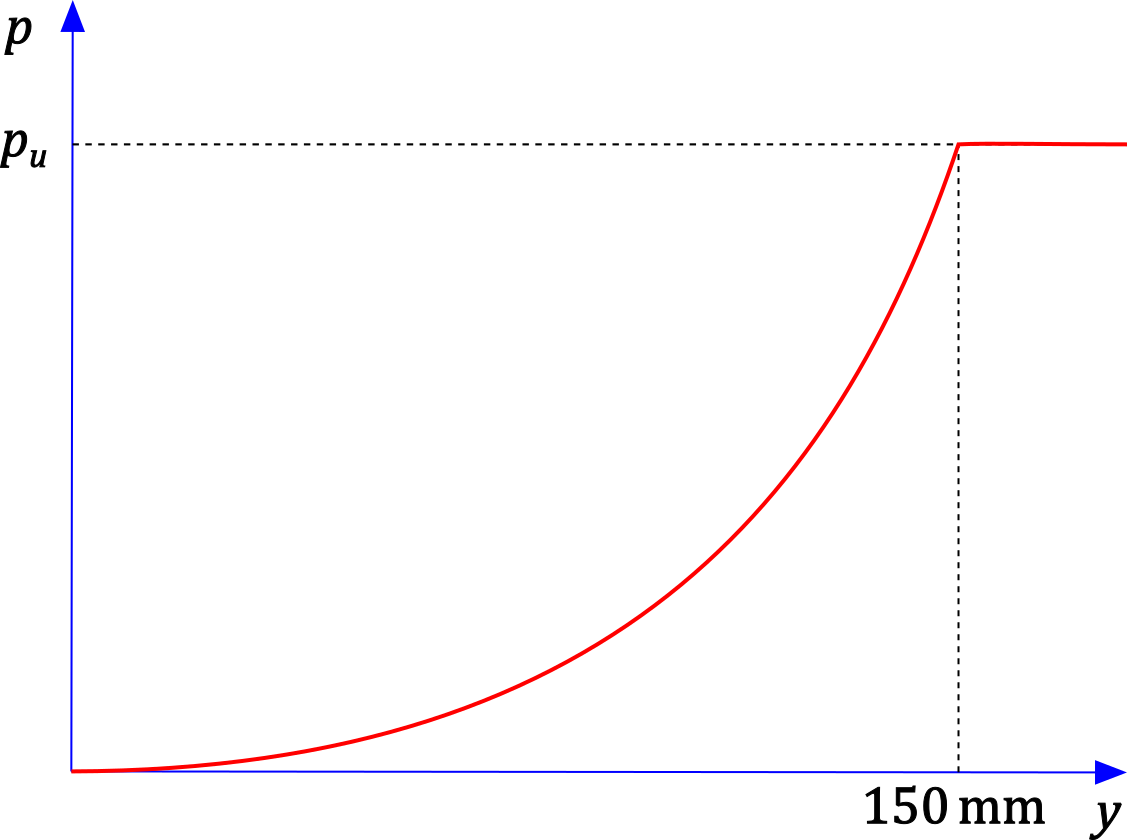 Figure 1: p-y curve for liquefied sand (Rollins, 2005)
The nonlinear shape of the curve is described by a concave-upward function, which gives low values of soil resistance p for small displacements y. This is because at small displacements, most of the load is carried by the pore water pressure, and the sand grains interact with each other only very little. As the displacement gradually increases, the soil resistance begins to increase as the sand grains start to bear against and interlock with each other. The increase in soil resistance becomes progressively steeper until the ultimate value pu is reached at a displacement of 150 mm, after which it remains constant.
The input parameters for determining the curve are:
d [m] | – | pile diameter |
z [m] | – | depth below the ground surface |
For displacements smaller than 150 mm, the p-y curve is given by:

where


At the displacement yu = 150 mm, the curve reaches the ultimate soil resistance pu:

and beyond that point, it remains constant at this value.